EY
Dynamic data delivery for
EY’s Capital Confidence Barometer

Dynamic data delivery for
EY’s Capital Confidence Barometer
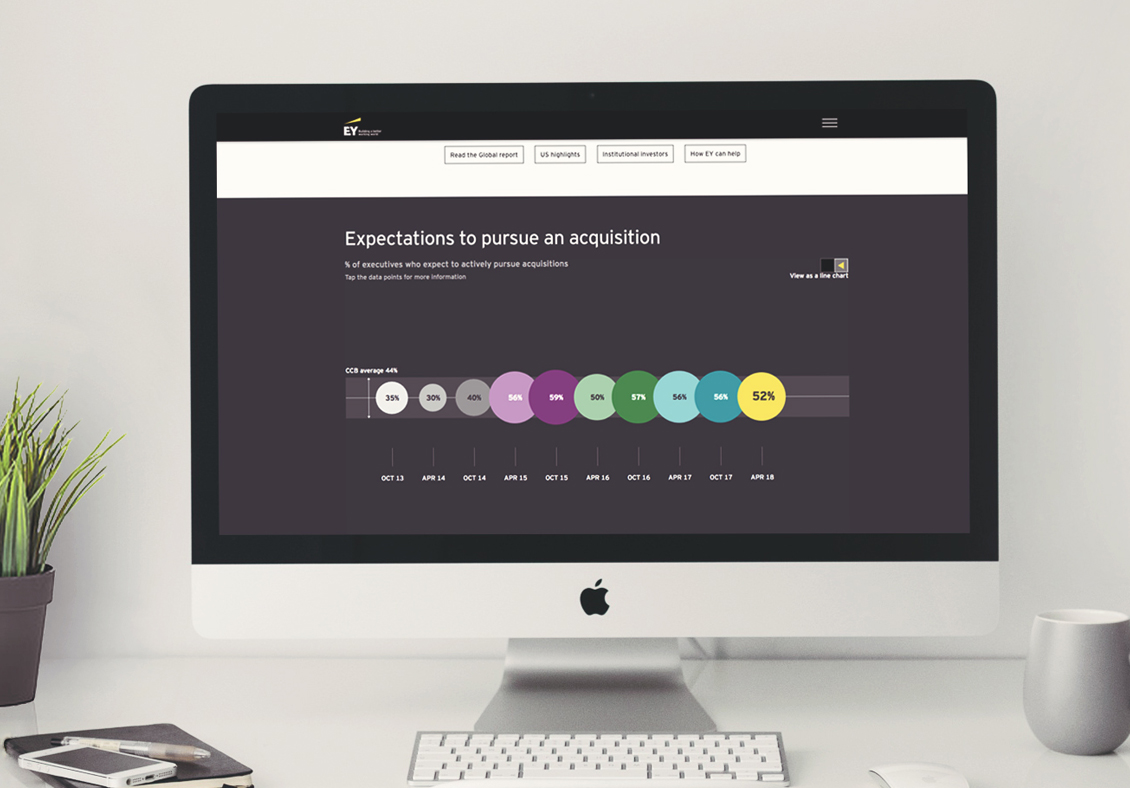
EY approached us to help them bring to life the Capital Confidence Barometer data charts in a more sophisticated and engaging way.
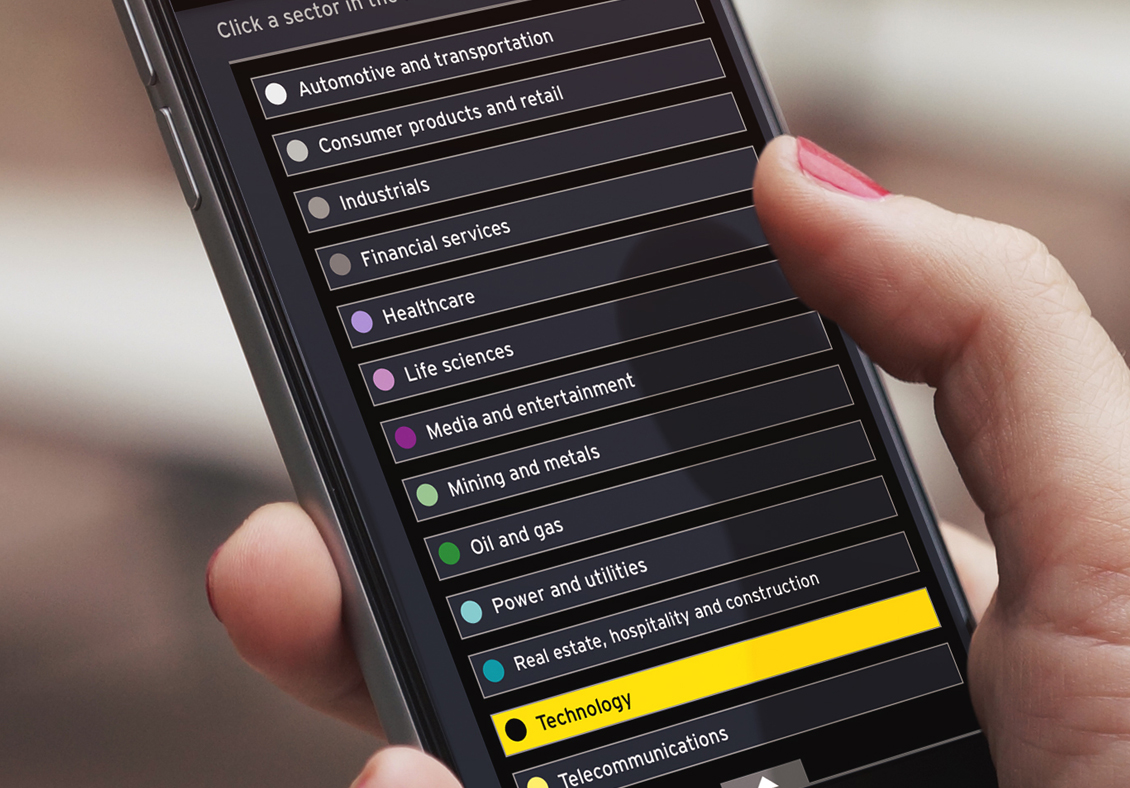
They wanted a set of charts and a questionnaire which would surface key data that was both interactive and interesting for users.
For us this was an opportunity to push the boundaries of data visualisation and explore a new approach to conveying the data online.
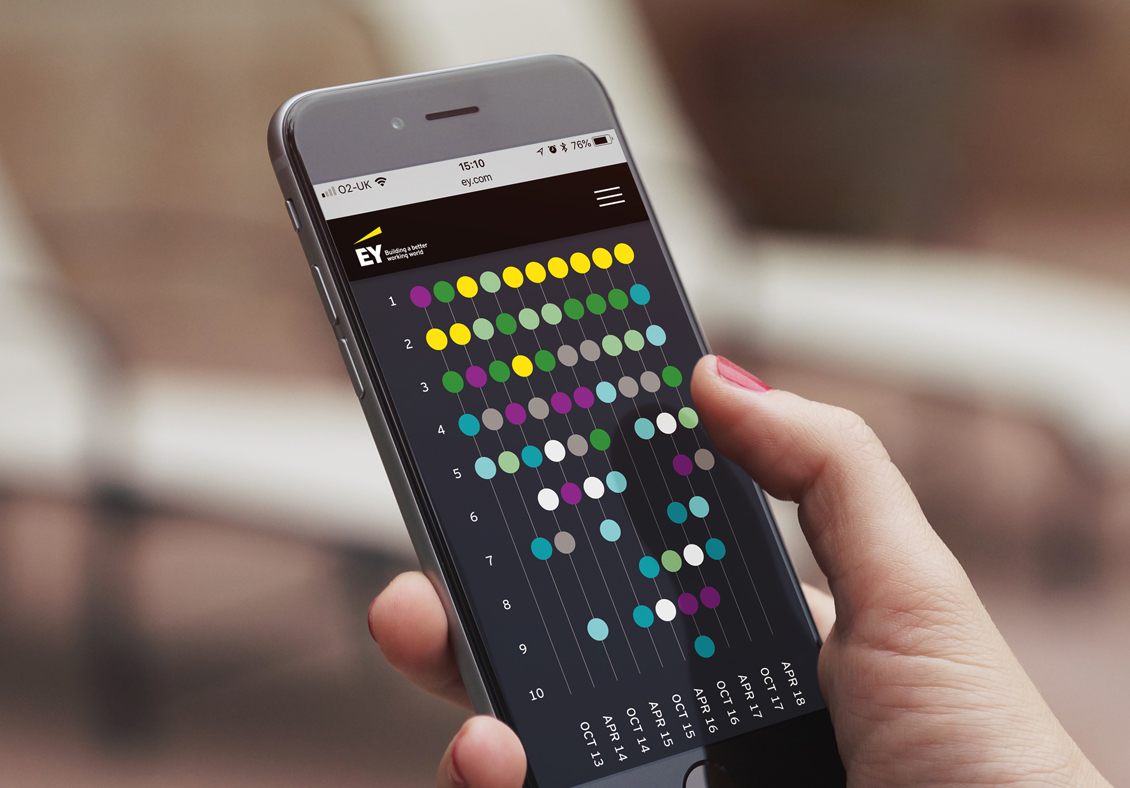
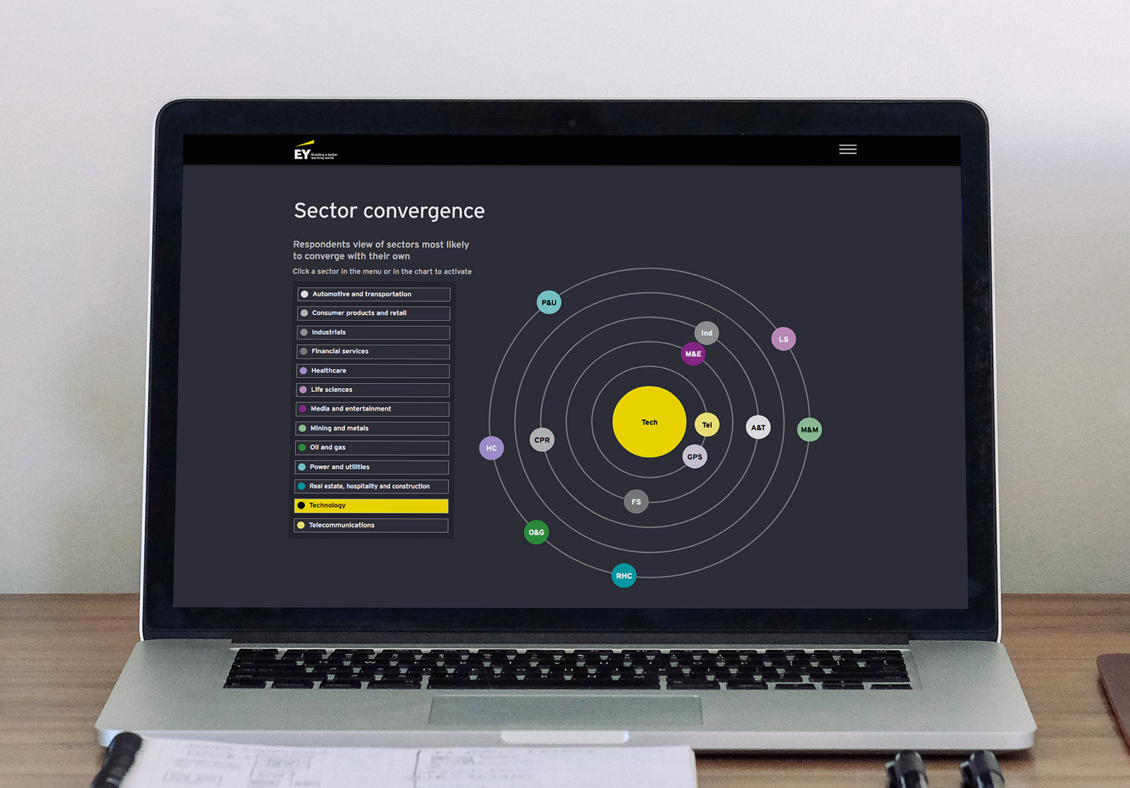
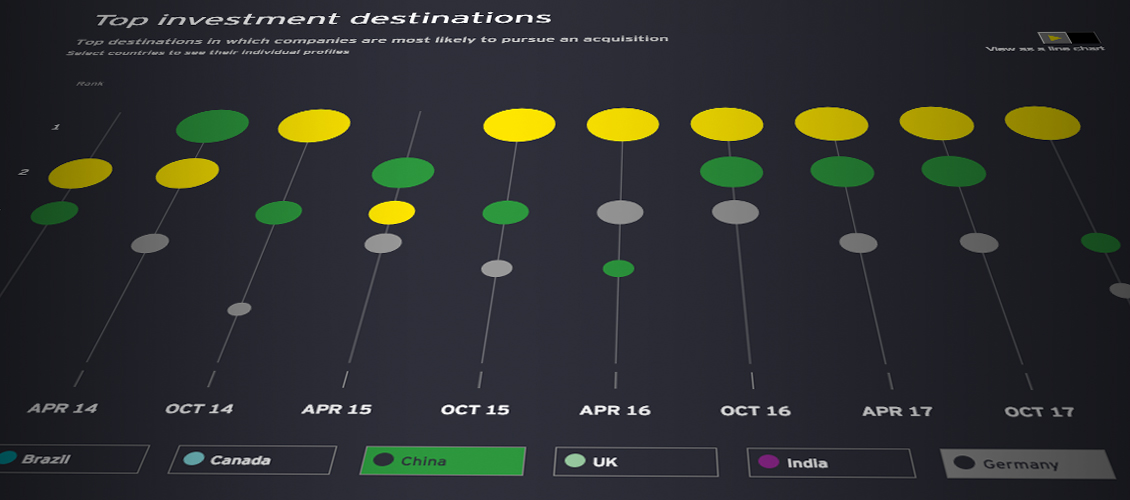
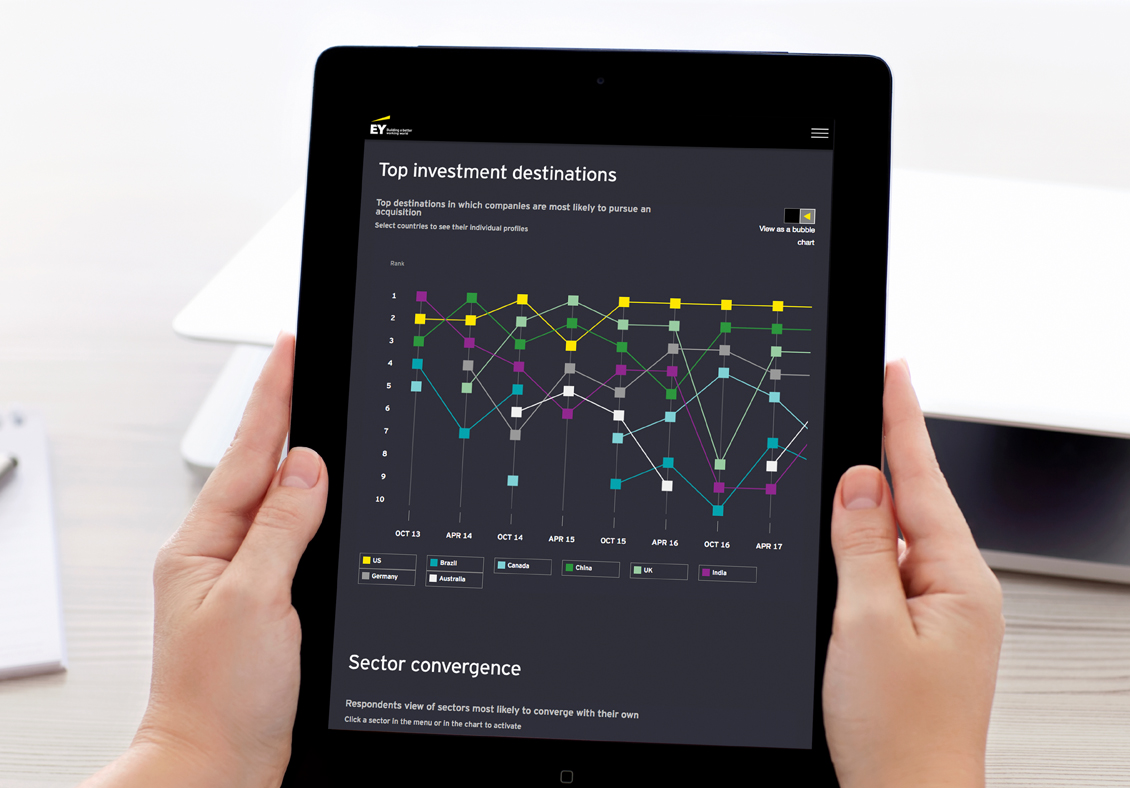
We moved away from the traditional charting styles frequently used across large corporates and developed a colourful, minimal approach to dynamic data charts which were visually compelling whilst remaining simple in their delivery. A key part of our process was to develop a logarithmic based output of spheres. This is an unprecedented technique which works respectively across mobile and desktop.
The charts were fully integrated with Google Analytics to allow for tracking and key ROI for the marketers to understand the readers key insights and user journey.
The Capital Confidence Barometer was used for a sixth month campaign and gained significant positive feedback from the EY team and its users. Further recognition was also received with the tool winning the 'Best Use of Data' at both the Corporate Content Awards and Digital Impact
Since the launch of The Capital Confidence Barometer, we've helped EY launch the Profit Warnings Console an engaging and interactive online tool that gives their target audiences relevant and useful insight.